Dashboard
The dashboard: what each box means, alerts, and custom dashboards per permission group.
The Dashboard
The Dashboard is the first page after login. It gives a quick overview of your subscribers, money and system. Which dashboard you see depends on your permission group: the built-in Professional Dashboard or a custom dashboard (see Custom Dashboards).
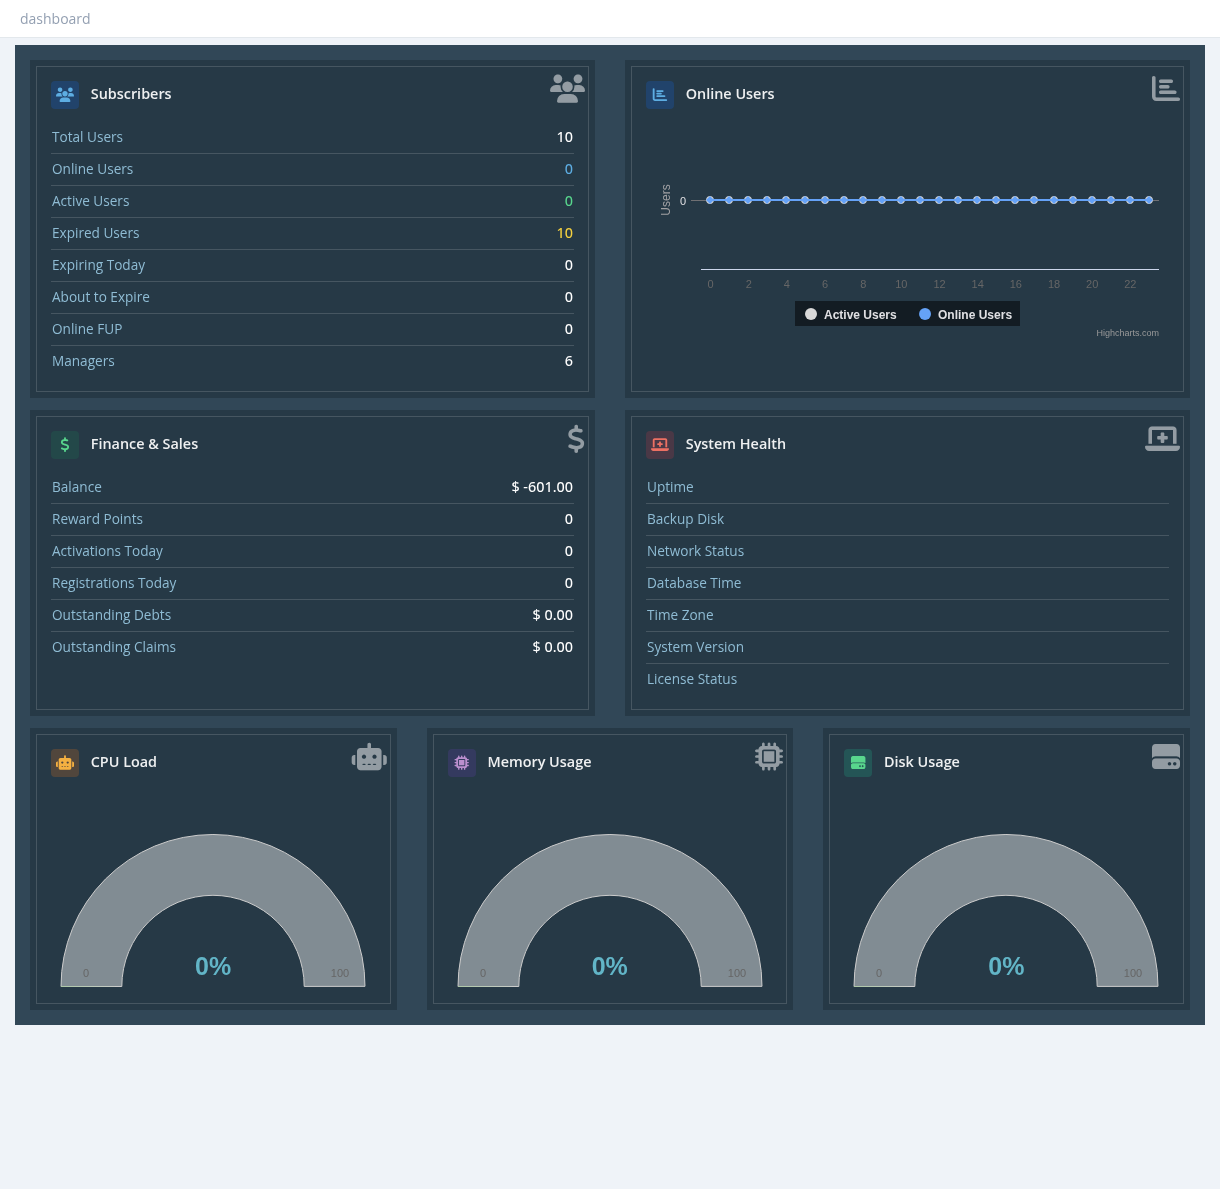
Professional Dashboard
| Box | Shows |
|---|---|
| Subscribers | Total Users, Online Users, Active Users, Expired Users, Expiring Today, About to Expire (next days), Online FUP (online users on a reduced profile), Managers. Numbers include only the users you are allowed to see. |
| Online Users | Chart of active and online users over the last 24 hours. |
| Finance & Sales | Your Balance and Reward Points, Activations Today, Registrations Today, Outstanding Debts (what you owe other managers) and Outstanding Claims (what other managers owe you). |
| System Health | Uptime, Backup Disk (attached or not, and usage), Network Status (internet and DNS), Database Time, Time Zone, System Version, License Status. |
| CPU Load, Memory Usage, Disk Usage | Live server load gauges. |
The boxes refresh every minute; the gauges every few seconds.
Alerts
- Your license is about to expire soon: renew the license (Settings → license).
- You have exceeded the number of allowed users (system administrators): delete unused users or upgrade the license.
- A message from your administrator, set in Settings → notifications (dashboard notification).
- A New Software Update Available banner for system administrators.
What to check every day
- Network Status is Internet Reachable and License Status is active.
- Backup Disk is attached and not full.
- Disk Usage stays below about 80%.
- Online Users matches what your routers show.
Custom Dashboards
Instead of the Professional Dashboard, you can give each permission group its own dashboard made of widgets (tiles with a number, such as online users, balance or expiring users). For example, resellers can see only their users and balance, while support staff see online and expiring users.
Steps
- Create widgets in Tools → Widget Factory: title, colour, icon, width and data source.
- Build a dashboard in Tools → Dashboard Manager: add rows and drag widgets into them, then save.
- Assign it in Settings → permission groups → select the group → Set Dashboard.... All managers of that group see it after their next login or page reload.
Full details, including all widget data sources, are on the Tools page Dashboard Manager and Widget Factory.
- Choose Professional Dashboard in Set Dashboard to go back to the built-in dashboard.
- Widgets show numbers only for the users the viewing manager is allowed to see.
- Your company logo is shown above custom dashboards when Show Site Logo is enabled in General Settings.
Required permissions: Dashboard - Manage and Dashboard - Widgets Factory (to build); Managers - System Administrator (to assign)