
Profits Report
Reports → Profits shows a manager's profit per month for a year.
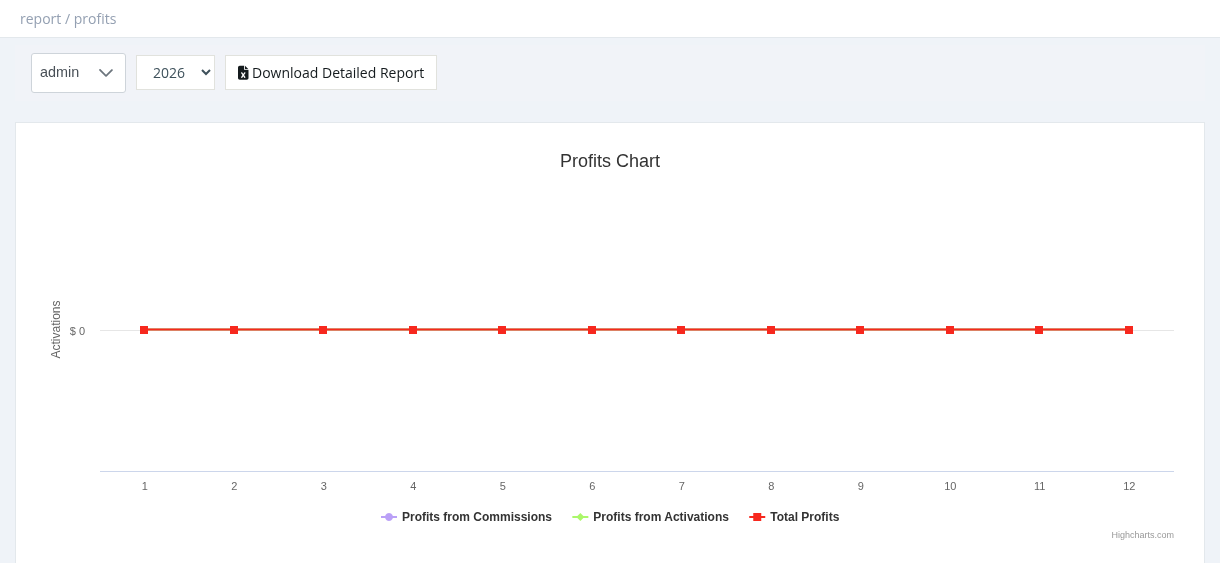
Select the manager and the year. The chart has three lines:
| Line | Calculation |
|---|---|
| Profits from Commissions | Commissions earned from sub-managers' activations: for each activation, the sub-manager's price minus this manager's price. |
| Profits from Activations | For activations made by this manager: the subscriber price (User Price) minus the manager's cost. |
| Total Profits | The sum of both. |
- Activations with a low or zero User Price lower the profit.
- Managers with a discount rate don't generate commissions for their parents.
- Select one manager at a time; sub-managers are shown separately.
Detailed report
Download Detailed Report (needs Managers - Index (All Managers)) downloads an Excel file with every activation of a chosen month for all managers: date, manager, profile, price, tax rate, tax amount, total price, manager ID, notes and parent.